GBPUSD is in a strong uptrend since the 13 November. On the 4 hour chart, it is clear that GBPUSD is making higher highs and higher lows which indicate it is in a strong uptrend. Furthermore, it is also above its 20 EMA (blue line) which is putting more upside pressure to it.
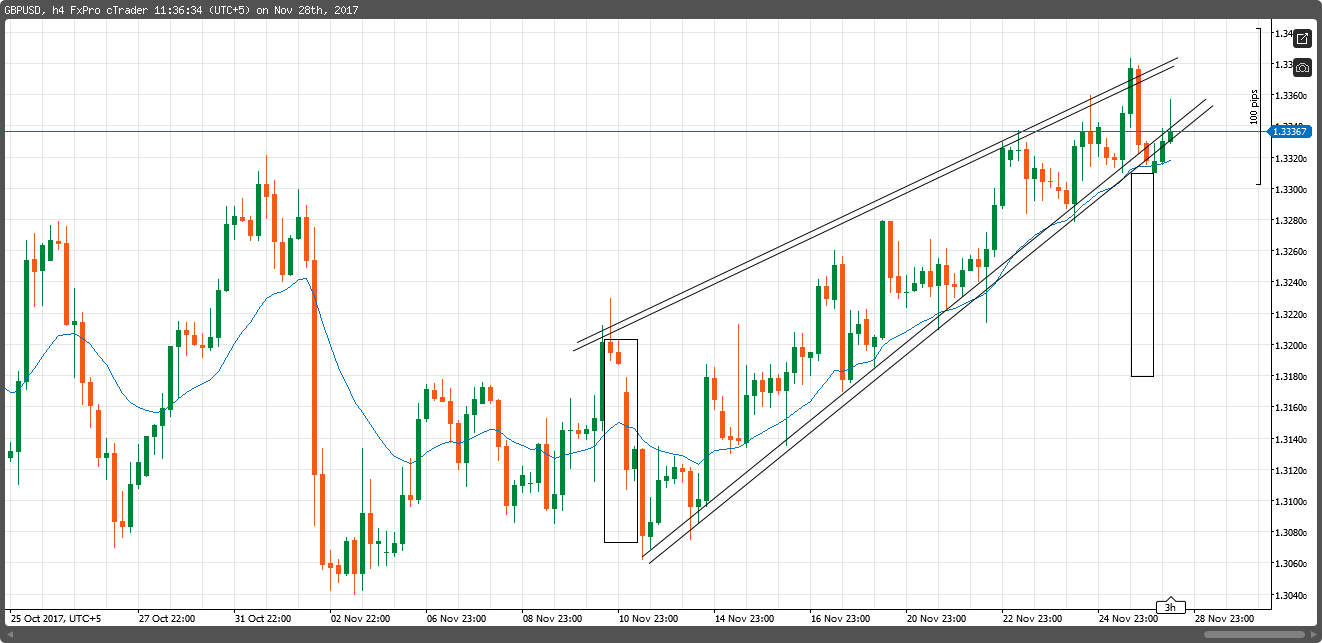
However in our view, the uptrend might be coming to an end. As you can see in the 4hr chart, rising wedge formation is present which if broken, can target 1.3180. Before taking any short positions, it is important to see a strong bearish momentum (strong 4 hour bearish candle close). Personally, I would wait untill we get a 4hr candle close below 1.3300 before going short.
Update: Well the bearish setup was looking really solid. However news of brexit deal resulted in new bullish momentum. The bottom trendline is still valid though.
Thanks for the useful analysis umer.